Visualization of CurrentCost xml data
Also available in Calc - Excel - Javascriptby Olav Buunen, Nijmegen, the Netherlands - Contact: olav buunen
|
|
What is it
?
The output data of the C2 monitor is saved to the file cc_debug.txt. C2 Terminal (download from CurrentCost site)
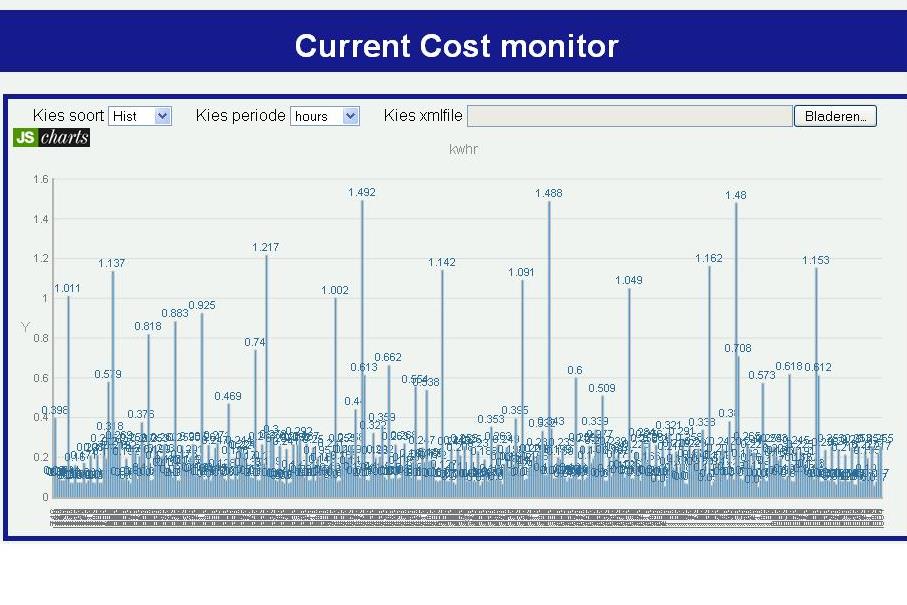
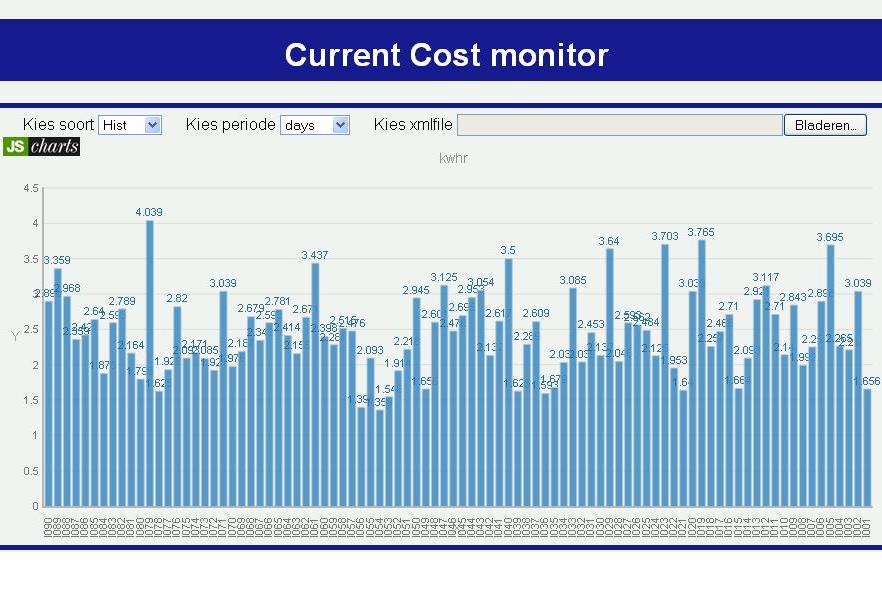
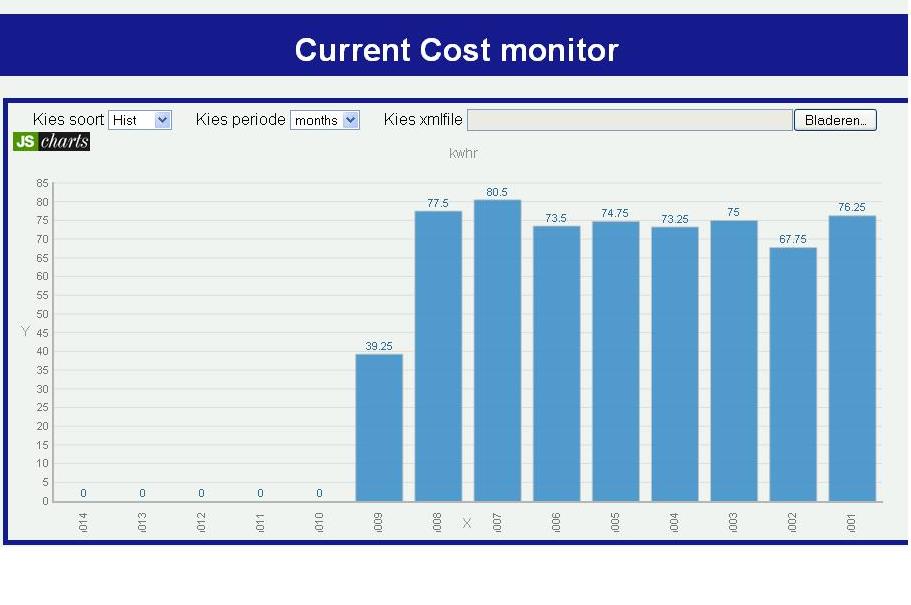
In order to visualize the data, this webpage with Javascript can be used. The webfiles contained in cc_local.zip will: a) show actual data in graph b) show historical data in hours, days or months Example graphs are shown in the right column of this page. You can open a demonstration page to experience the effect. What do you have to do? Start the C2 terminal software and select a directory for the output file. put the cc_debug.txt file in the same directory as the Calc file. Select the com port (COM10 for USB cable). Open port around any odd hour, like 09:00, 11:00 or 19:00 hrs. Close port after all historic data was send, around 25 min. past the hour. open the file cc_debug.txt and a) change the first timestamp line in <xml> b) change the last timestamp line in </xml> save the file as 'cc_debug.xml' or [myfilename].xml Unzip the files in a directory for example 'cc_local'. Open the index.html file in your browser. Select Hist or Actual and use the box to load another xml-file. Your graphs will be shown in your browser window! How does it work? The data from cc_debug.txt has to be prepared as a xml-file. This xml-file can be read using Javascript and the prototype library using AJAX. The graph is drawn using the JScharts library. When a different selection is made, the file is read again and the graph is updated. Files included in cc_debug.zip:
|
Live graph (every 6 seconds) |
||||||||||||||
|
760 hours graph (2 hour resolution) |
|||||||||||||||
|
60 days graph |
|||||||||||||||
|
16 months graph |
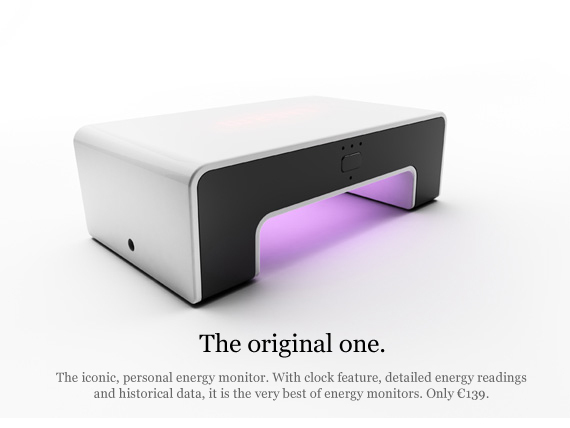
 Developed as a utility
programme, the C2 Terminal
is designed for users test
connectivity to the serial port of
Current
Cost monitors and view the raw XML
data in a low-fi style. The C2
terminal works with all data enabled
Current Cost devices: both
versions of the Classic and the Envi
(CC128).
Developed as a utility
programme, the C2 Terminal
is designed for users test
connectivity to the serial port of
Current
Cost monitors and view the raw XML
data in a low-fi style. The C2
terminal works with all data enabled
Current Cost devices: both
versions of the Classic and the Envi
(CC128).
 Available downloads:
| cc_local.zip
|
Website
to
be used on local pc. Includes sample. |
|
| cc_debug.xml
|
Sample
C2 terminal output
file, with timestamps removed and
xml-tags added |