Visualization of CurrentCost xml data
Also available in Calc - Excel - Javascriptby Olav Buunen, Nijmegen, the Netherlands - Contact: olav buunen
|
|
What is it ? The output data from the C2 Terminal is saved to the file cc_debug.txt. C2 Terminal (download from CurrentCost site)
In order to visualize the data, an Open Office Calc spreadsheet can be used. The OpenOffice Calc file cc_debug_report.ods will: a) convert the standard cc_debug.txt file in a .csv format b) transform the content of the csv-file in a graphical way, showing live data and historic data in separate graphs. Example graphs are shown in the right column of this page. What do you have to do? Start the C2 terminal software and select a directory for the output file. put the cc_debug.txt file in the same directory as the Calc file. Select the com port (COM10 for USB cable). Open port around any odd hour, like 09:00, 11:00 or 19:00 hrs. Close port after all historic data was send, around 25 min. past the hour. convert the cc_debug.txt file into a cc_debug_[date].csv (click on start on the output sheet) open the cc_debug_[date].csv file in Calc, with semicolon ";" as a separator. Copy the data to the input sheet convert the input sheet data into the output sheet format (click on start on the output sheet) Now the graphs are updated with the new data! How does it work? The data from cc_debug.txt has to be prepared to be imported as a csv-file in Calc. The macro reads the file and adds semicolons in between the xml tags, so that they will be read in separate columns. A new file is written as cc_debug_[date].csv. This file can be imported into Calc. When the data is copied to the input-sheet in the spreadsheet, the transformation to the output-sheet can be started. In the transformation, the actual and historic lines will be separated. From the actual lines the Temperature and Watt value will be copied to the first columns of the output-sheet. Historic lines will be read and stored in data arrays, if wanted for up to 5 sensors. Separate arrays are used for the hour, day and month values. After all lines have been read, the macro will write historical data to the output-sheet: hours, days and months. These data ranges are input to the graphs. Spreadsheet
sheets in
cc_debug_report.ods:
- input sheet - output sheet including 'start'-button -
live graph
-
720 hrs graph
-
240 hrs graph
-
60 days graph
-
12 months graph
|
Live graph (every 6 seconds) |
|
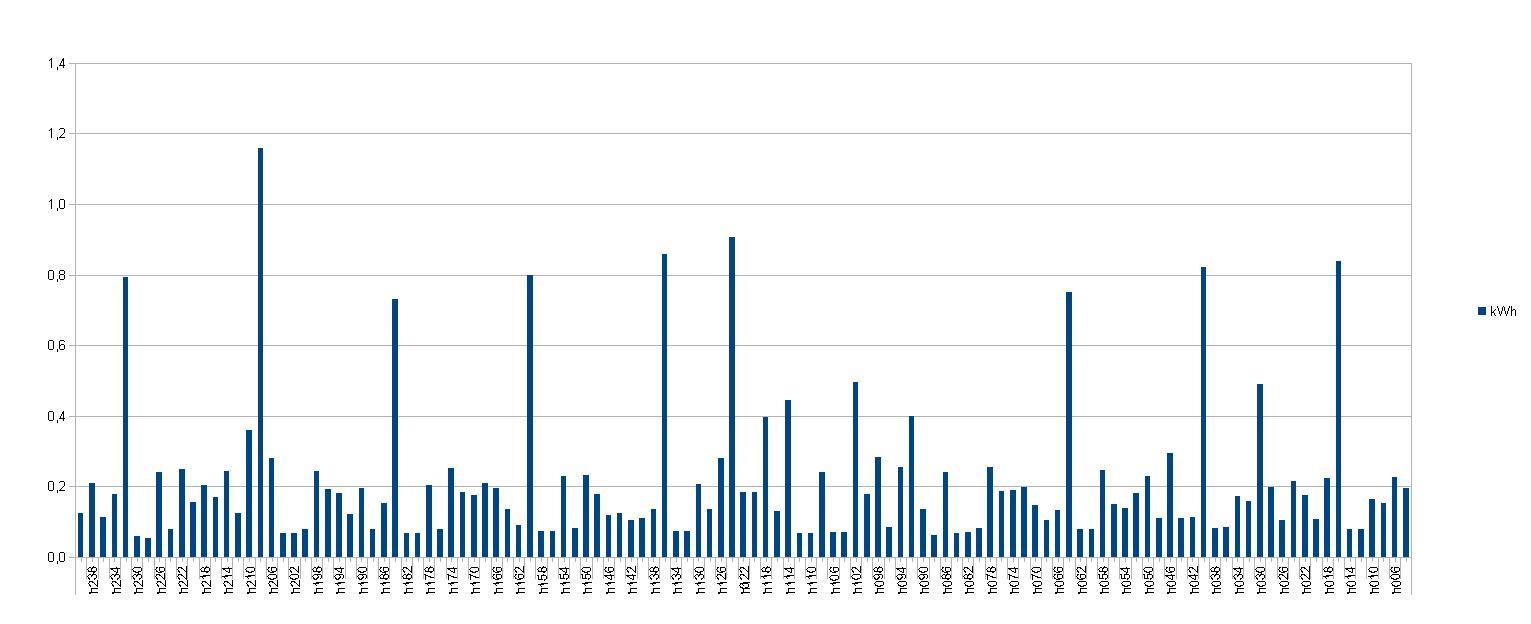
240 hours graph (2 hour resolution) |
|
|
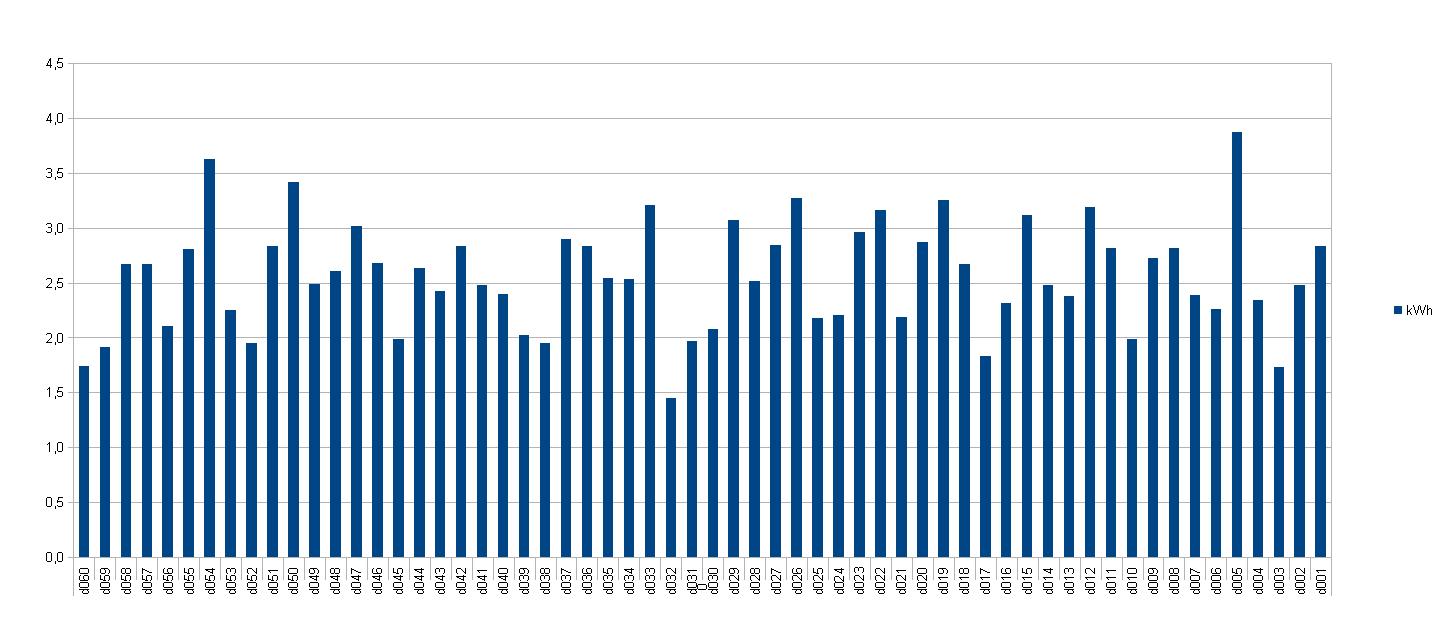
60 days graph |
|
|
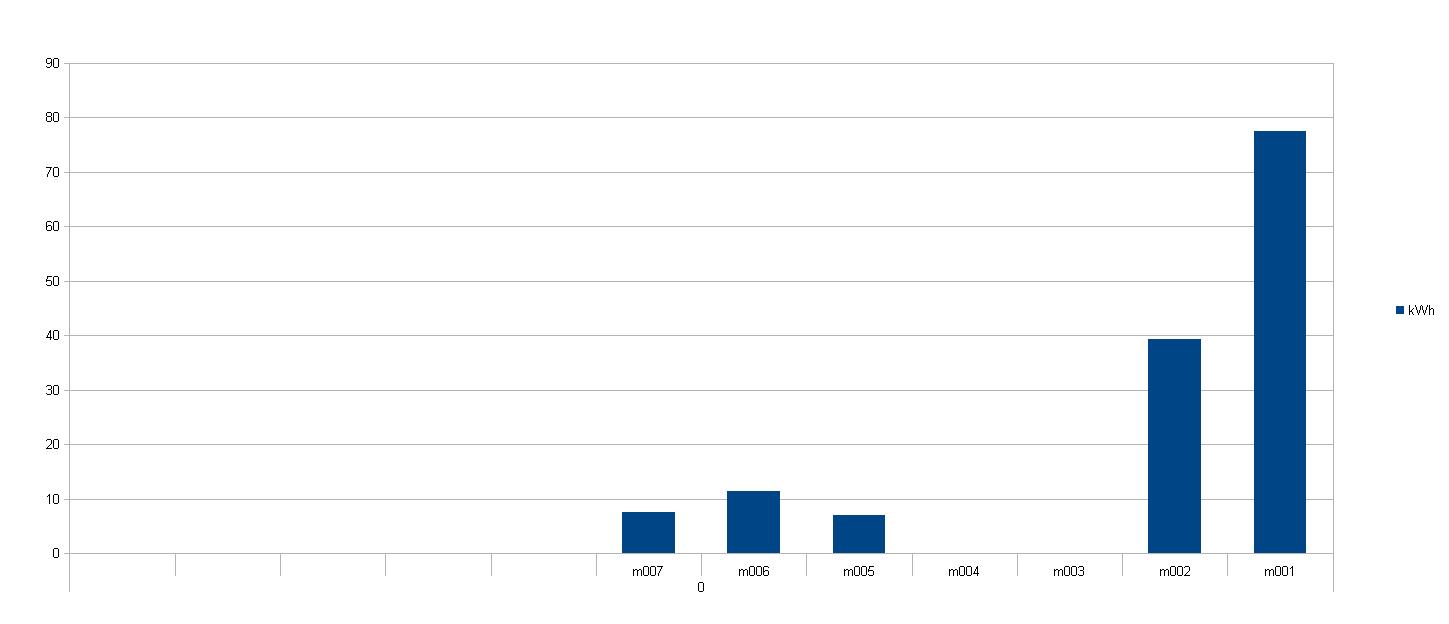
12 months graph |
|
 Developed as a utility
programme, the C2 Terminal
is designed for users test connectivity
to the serial port of Current
Cost monitors and view the raw XML data
in a low-fi style. The C2
terminal works with all data enabled
Current Cost devices: both
versions of the Classic and the Envi
(CC128).
Developed as a utility
programme, the C2 Terminal
is designed for users test connectivity
to the serial port of Current
Cost monitors and view the raw XML data
in a low-fi style. The C2
terminal works with all data enabled
Current Cost devices: both
versions of the Classic and the Envi
(CC128).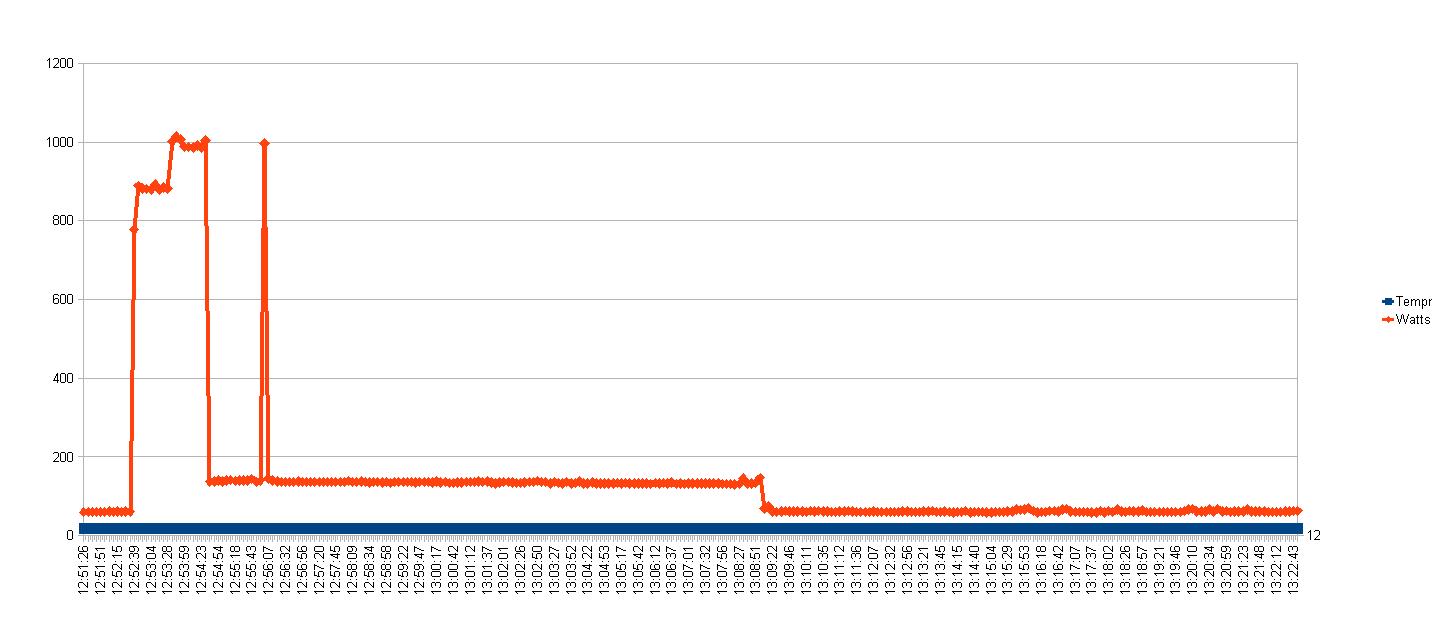
 Available downloads:
| cc_debug_report.ods
|
OpenOffice
Calc
file. Includes sample
data and the macro. |
|
| cc_debug.txt
|
Sample
C2 terminal output
file |